
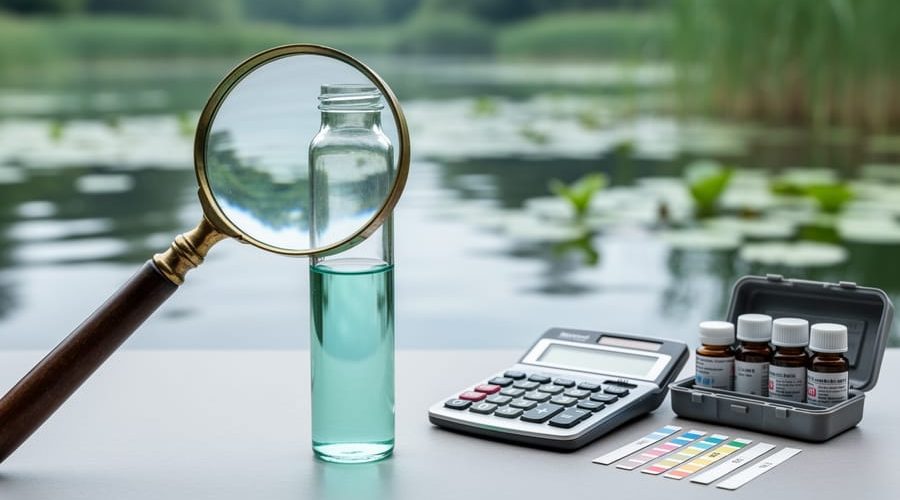
The Q-Test in Analytical Chemistry: Your Secret Weapon for Accurate Pond Water Testing
The Q-test helps you decide whether an outlier in your pond water test results is a genuine measurement error that should be tossed out, or real data you need to take seriously. When you’re testing trace elements like copper, iron, or zinc and one reading seems wildly off from the others, this simple calculation tells you whether to discard it or investigate further. It takes about five minutes with a calculator and works best when you have three to ten measurements of the same sample.
If you’ve ever tested your pond’s copper levels three times and gotten readings of 0.12 ppm, 0.13 ppm, and 0.87 ppm, you know the frustration. Is that high reading a contaminated sample? A mistake in dilution? Or is there actually a copper spike happening in one zone of your pond? Getting this wrong means either panicking over bad data or missing a real problem that could harm your fish.
The Q-test gives you a statistical answer instead of a guess. Unlike complicated stats that require software or advanced math, this method uses one straightforward formula and a lookup table. You calculate a Q-value from your measurements, compare it to a critical value, and get a yes-or-no answer about whether the suspicious data point should be rejected.
Most pond owners encounter the Q-test when they’re tracking heavy metals, testing multiple samples from different pond zones, or trying to verify whether their test kit is giving consistent results. Understanding when and how to apply it turns you from someone who just collects numbers into someone who can confidently interpret what those numbers actually mean for your water quality decisions.
What Is the Q-Test (In Plain English)?
The q-test is essentially a reality check for your water test results. When you test pond water multiple times for the same parameter, say, copper levels, you expect the numbers to cluster pretty close together. Maybe 0.15 ppm, 0.18 ppm, 0.16 ppm. But what happens when your fourth test suddenly shows 0.85 ppm? Is your pond actually experiencing a copper spike, or did something go wrong with that one test?
That’s where the q-test comes in. It’s a straightforward calculation that tells you whether that oddball reading is statistically suspicious enough to ignore. Think of it like this: if you weighed yourself five mornings in a row and got 165, 167, 166, 164, then suddenly 201 pounds, you wouldn’t panic about gaining 35 pounds overnight. You’d assume the scale malfunctioned or you stepped on it wrong. The q-test applies that same common-sense logic to your pond chemistry numbers.
Why does this matter for pond owners? Trace elements like iron, copper, and zinc exist in tiny concentrations, often measured in parts per million or even parts per billion. At these levels, testing becomes finicky. A bit of contamination on your test vial, an expired reagent, or even the way you filled the sample can throw off a single reading while the others remain accurate. Without the q-test, you might make decisions based on bad data, treating your pond for a copper problem that doesn’t exist, or worrying unnecessarily about iron levels that are actually fine. The q-test helps you separate genuine chemistry changes from testing hiccups, so you can act on reliable information instead of statistical noise.
Why Pond Owners Should Care About Outliers
You’re standing at your pond with a copper test kit, and the reading says 0.8 ppm. That’s high, potentially toxic to your koi. Your mind races: Should you do a massive water change? Start treating with a chelator? Move your fish to a holding tank? But here’s the problem: what if that reading is just wrong?
Bad test results aren’t just annoying numbers on paper. They trigger real decisions that affect your pond, your fish, and your wallet. When you overdose a copper-based algae treatment because you trusted one inflated reading, you can stress or even kill sensitive fish. When you panic about elevated iron levels and start adding expensive water conditioners unnecessarily, you’re solving a problem that never existed. I’ve watched pond owners spend hundreds of dollars chasing phantom chemistry problems because they acted on a single questionable test result.
Trace elements make this worse. Unlike pH or ammonia, which pond test kits measure in whole numbers or clear color changes, trace elements like copper, iron, zinc, and manganese exist in tiny concentrations, we’re talking parts per million or even parts per billion. At these scales, everything matters: a fingerprint on the test vial, a tiny soap residue, even humidity in the air. Your test kit is trying to detect amounts so small that honest mistakes happen easily.
That 0.8 ppm copper reading? Maybe your hands had trace metal from touching a brass hose fitting. Or the test strip was exposed to moisture. Or you accidentally timed the color development wrong. Meanwhile, your actual copper level might be a safe 0.2 ppm, and your fish are fine.
This is exactly why outliers matter. One weird result in a set of measurements can lead you down an expensive, stressful path. Learning to spot these questionable readings, and having a systematic way to decide whether to trust or reject them, turns you from a reactive pond owner into a thoughtful one.
When to Use the Q-Test on Your Pond Water Results
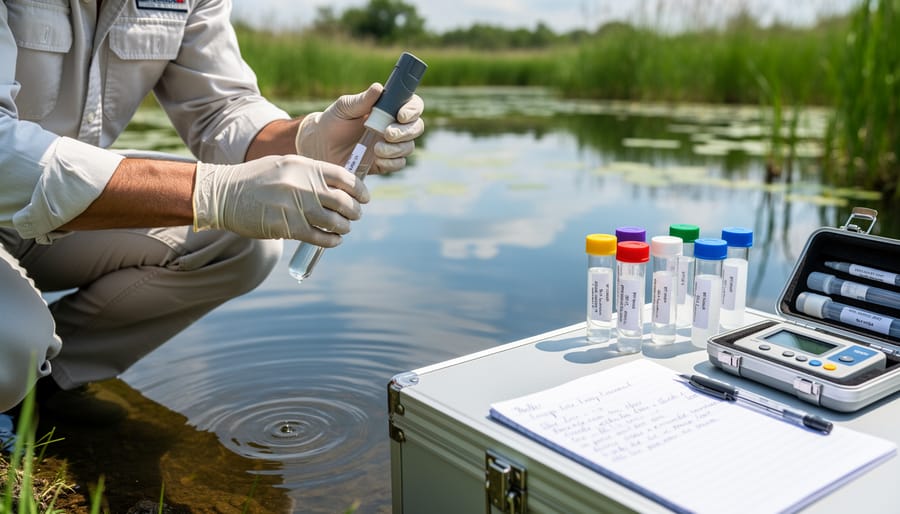
The q-test isn’t something you’ll use every time you dip a test strip in your pond. It’s a specific tool for specific situations, and knowing when to reach for it will save you time and confusion.
The ideal scenario for the q-test is when you’ve collected multiple samples from the same location in your pond on the same day. Maybe you’re being extra careful because you’re about to treat for algae, or perhaps you noticed your fish behaving oddly and you want to nail down exactly what’s happening with your water chemistry. You test the same water three, four, maybe five times, and suddenly one reading jumps out as completely different from the others. That’s when the q-test earns its keep.
Trace element testing is where the q-test really shines. When you’re measuring copper levels because you’re considering a copper-based algaecide, precision matters. Copper concentrations that help control algae sit in a narrow range, and overdosing can stress or kill fish. Similarly, iron testing is crucial if you’re trying to figure out why your water lilies look pale or your submerged plants aren’t thriving. These trace elements exist in such tiny amounts (we’re often talking parts per million or even parts per billion) that test kit errors are frustratingly common.
You’ll also find the q-test helpful after pond treatments. Say you added a chelated iron supplement for your plants and you’re monitoring levels over the next few days. If one reading seems way off compared to the trend, the q-test can tell you whether that result deserves a retest or if it’s probably just measurement noise.
How to Actually Do the Q-Test (Step-by-Step)

The Q-Test Reference Table You’ll Need
Here’s your quick reference table for making decisions when testing pond water. This is the comparison chart you’ll use after calculating your Q value, it tells you whether that suspicious reading really is an outlier or if you should keep it.
| Number of Measurements | Critical Q Value (90% confidence) |
|---|---|
| 3 | 0.941 |
| 4 | 0.765 |
| 5 | 0.642 |
| 6 | 0.560 |
| 7 | 0.507 |
| 8 | 0.468 |
| 10 | 0.412 |
Using this table is straightforward. Find the row matching how many measurements you took, then look at the critical value. If your calculated Q is larger than the table value, that outlier is probably wrong and you can safely ignore it. If your Q is smaller than the table value, keep all your results, the suspicious reading might actually be legitimate.
For example, when doing metal testing with five measurements, you’d use 0.642 as your cutoff. A calculated Q of 0.710 would exceed that threshold, confirming the outlier should be rejected. A Q of 0.580 would fall short, meaning you’d keep all five readings even though one looks different.
The 90% confidence level means you’ll make the right call about nine times out of ten, good odds for pond water decisions that don’t involve life-or-death precision.
Real Pond Example: Testing for Trace Iron
Let’s walk through a real scenario that pond owners face all the time. Sarah has beautiful water lilies that aren’t blooming like they should, and her submerged plants look pale. She suspects an iron deficiency, so she tests her pond water five times over two days to get a reliable reading. Here are her results in parts per million (ppm): 0.15, 0.18, 0.42, 0.16, and 0.17.
That 0.42 reading jumps out immediately. It’s more than twice the other measurements. But is it a genuine spike or just a testing error? This is exactly when the q-test shines, because iron levels directly affect plant vigor and overall fish health and you don’t want to make dosing decisions based on bad data.
First, arrange the numbers from lowest to highest: 0.15, 0.16, 0.17, 0.18, 0.42. The suspect value is 0.42 because it’s furthest from the pack.
Now calculate the range (highest minus lowest): 0.42 minus 0.15 equals 0.27.
Next, find the gap between the suspect value and its nearest neighbor: 0.42 minus 0.18 equals 0.24.
Divide the gap by the range to get your Q value: 0.24 divided by 0.27 equals 0.89.
With five measurements, the reference table tells us the critical Q value is 0.64. Sarah’s calculated Q of 0.89 is higher than 0.64, which means that 0.42 reading should be rejected. It’s almost certainly a testing error, perhaps from contaminated equipment or a misread color chart.
So what should Sarah do? She can confidently ignore that outlier and work with the remaining four values. Their average is 0.165 ppm, suggesting her pond does have low iron. She might consider adding a chelated iron supplement for her plants. But here’s the smart move: before treating, she should run one or two more tests to confirm. The q-test identified hidden water problems in her data, but more good measurements always beat fewer when you’re making treatment decisions.
Common Mistakes to Avoid
Now that you know how to run the q-test, let’s talk about the ways pond owners typically mess it up. I’ve seen these mistakes plenty of times, and they usually lead to tossing out good data or keeping bad readings.
The biggest mistake is trying to use the q-test when you’ve only got two or three measurements. Remember, you need at least three data points for the test to work at all, and honestly, four or five is better. With just two readings, there’s no way to know which one (if either) is wrong. You’re just guessing at that point.
Here’s what trips people up most often:
- Running the test on only two or three samples when you really need four or five for reliable results
- Cherry-picking which measurement to call suspicious based on what you want the answer to be
- Dismissing repeated “outliers” that might actually be telling you something real is happening
- Using test kits past their expiration date, then blaming the q-test when numbers don’t make sense
Another trap is applying the q-test to measurements taken on different days or from different spots in your pond. The test assumes you’re looking at the same water under the same conditions. If you tested Monday’s water and Friday’s water, any difference might be real change, not testing error.
And here’s the thing people forget: sometimes that weird outlier is correct. If you added a copper-based algaecide yesterday and today’s copper reading is sky-high compared to last week’s tests, that’s not a testing error. That’s reality. The q-test can’t tell the difference between a measurement mistake and actual change in your pond chemistry.
Treat the q-test as a nudge toward skepticism, not a crystal ball. It raises a red flag worth investigating, but it doesn’t hand you absolute certainty.
Beyond the Q-Test: Building Better Testing Habits
The q-test gives you confidence in your numbers, but preventing dodgy results in the first place saves time and frustration. Smart pond water testing habits make the q-test less necessary and your overall readings more trustworthy.
Start with kit maintenance. Those test reagents don’t last forever, even if the bottle looks fine. Most liquid reagents have a shelf life of 12-18 months after opening, and trace element test strips degrade even faster once exposed to air. Check expiration dates religiously, and if your iron or copper tests have been sitting in the shed through a hot summer, they’re probably toast. Store kits in a cool, dark place, not in direct sunlight or next to your pool chlorine.
Rinse your testing equipment between samples with the same pond water you’re testing, not tap water. Tap water contains trace amounts of chlorine, fluoride, and often copper from pipes, which will contaminate trace element tests. Even a few drops left in a test vial can skew results. I do three quick rinses with pond water before the actual test.
Sample location matters more than most people realize. Always take water from the same spot and same depth when you’re tracking trends or taking multiple readings for a q-test comparison. Water chemistry varies across your pond, near the waterfall differs from near the bottom drain, which differs from the shallow plant shelf. Pick one representative spot and stick with it.
Record everything, not just the results that “look right.” That outlier you want to ignore might reveal something real, like a sudden spike after rain or fertilizer runoff. Good records let you spot patterns and understand your pond’s normal variation range for different parameters.
Accept that trace element testing will never be as precise as pH or ammonia testing. You’re measuring parts per billion sometimes, where even high-quality kits have a margin of error. The goal isn’t laboratory perfection but sufficient accuracy to maintain healthy water balance. Use multiple tests to inform decisions, not single readings.
The q-test isn’t about turning you into a lab technician. It’s about giving you confidence in the numbers that guide your pond care decisions. When you’re staring at four test results that mostly agree and one that’s wildly different, you now have a simple way to decide whether that outlier deserves your attention or your dustbin.
Think of it as part of your broader testing routine. Take multiple measurements when something important is on the line, write everything down (even the weird results), and pull out the q-test when your gut tells you something’s off. You don’t need to use it every time you test your water. Save it for those moments when accuracy really matters, like before treating for algae or diagnosing a plant nutrient problem.
Here’s the real payoff: understanding basic data quality transforms pond keeping from guesswork into informed decision-making. You’ll stop second-guessing yourself, waste less money on unnecessary treatments, and spend more time actually enjoying your water feature. That one confusing test result? You’ve got the tools to figure out what it means. Your pond, your fish, and your peace of mind will all benefit from that clarity.